CubeServ Blog
Bleiben Sie auf dem neuesten Stand, rund um das Data Driven Business mit Tools für Analytics von SAP & Co. und verpassen Sie keine Neuigkeiten, Downloads & Veranstaltungen.

Challenging times for Finance & Controlling

Let’s face the Challenges !
 
The current COVID-19 pandemic creates multi-faceted challenges for companies. There are several risks which need to be taken care of. People, Supply Chain, Production, Liquidity just to name a few. The risks itself are not new but the global magnitude of it is unprecedented. Globalisation might be regarded in a different light in future.
 
Finance/Controlling focuses strongly on the Liquidity and the possible threat of a recession. Cash is king for now. Companies who already invested in agile processes, software but also People will be able to reap profits now. Companies who are in the middle of such projects may by no means stop them, even though cost-cutting measures are in place. 
 
Take a minute and ask yourself as a member of the Finance/Controlling Team:
 
  • Can I fulfil my role as Business Partner and deliver „Value Added Analyis“?
  • Can I deliver all the answers to my management in a timely manner?
  • Do I have enough time to look at the numbers, get insights and comment them
    or in other words do my controlling job?
  • Did I get all relevant information, analysis, reports, dashboards, and support from my BI/IT department or did I have to start a spreadsheet and Power Point exercise?
  • Can I build my own reports, analysis and dashboard based on a corporate database?


blank

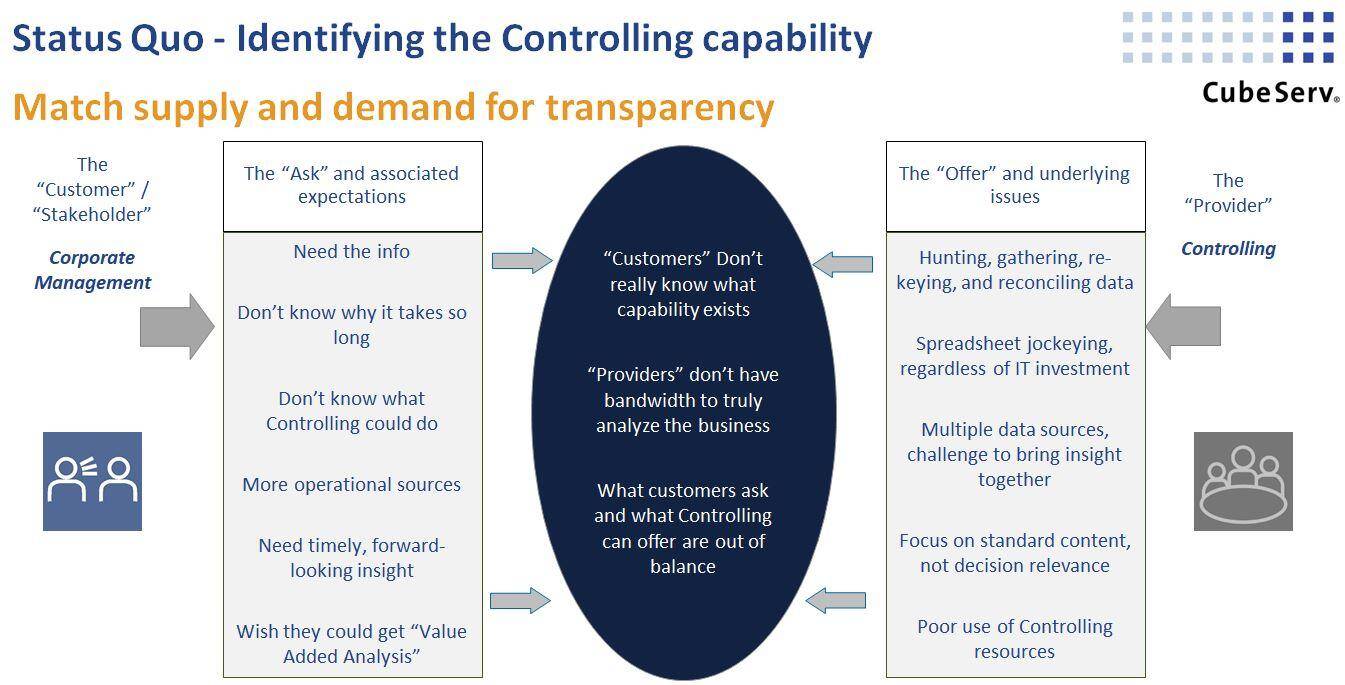
If you can fulfil all the afore mentioned topics, congratulations. Your organisation is well ahead of a lot of your competitors. If not, do not worry, there are fast ways to solve one or another of the above-mentioned issues.

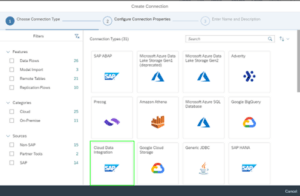
The SAP Analytics Cloud, the only modern SaaS solution for all-analytics capabilities covers most of your expectation towards Self-Service Business Intelligence (Spreadsheet like analysis, Dashboards etc.), Planning and Predictive. 


The augmented analytics capabilities, a next-generation data and analytics paradigm that uses machine learning to automate data preparation, insight discovery and insight sharing for a broad range of business users, operational workers and citizen data scientists will support your daily work in a tremendous way.


Please join us on our upcoming  Webinar series  Challenging Times for Finance & Controlling 


The Webinars audience are the Finance and Controlling teams. It will always include Live Demos and be held in English. 

Duration: approx. 45 min, all times are CEST.

Newsletter abonnieren

Bleiben Sie auf dem neuesten Stand, rund um das Data Driven Business mit Tools für Analytics von SAP & Co. und verpassen Sie keine Neuigkeiten, Downloads & Veranstaltungen. 

Autor
Expert Team

Blog Artikel unserer Experten

Moderne Planung mit SAP Datasphere und SAP Analytics Cloud

Wie funktioniert Planung mit SAP Datasphere und SAP Analytics Cloud (SAC)? SAP Datasphere (DSP) und SAP Analytics Cloud (SAC) sind zwei leistungsstarke Tools, die Ihnen helfen können, Ihre Prozesse zu optimieren. In diesem Kontext werden wir von unseren Kunden aber auch immer häufiger über die

CubeServ Group & Pyramid Analytics

CubeServ Group & Pyramid Analytics
Seit Juli 2023 ist die CubeServ Group Partner für die Konzeption und Implementierung der Pyramid Decision Intelligence Platform. Lesen Sie meinen Blog und finden Sie die Beweggründe für diese Partnerschaft heraus und wieso diese Partnerschaft auch für Sie von Vorteil sein kann.

Berichte im eigenen Design

Erstellen Sie SAP-Berichte in Ihrem Design

In SAP Analytics Cloud (SAC) gibt es diverse grafische Elemente, mit deren Hilfe Sie Daten verständlich darstellen können. Wie Sie eigene Grafikelemente in SAC integrieren und ihrem Design anpassen, zeigt unser Schulungsvideo.

CubeServ INSIDE LOOK 08/21

In der Situation einer komplexen Krise benötigen Unternehmen Sicherheit um ihre Ziele zu erreichen und die Fähigkeit sich schnell anzupassen.

circular-barplot-with-groups

Advanced Analytics mit SAP und R

Warum sich mit der SAP R-Integration beschäftigen? Die überwiegende Mehrheit der Unternehmen nutzt fortschrittliche Analysen mit R- und SAP-Tools, um zukünftige Ereignisse zu prognostizieren und datengestützte, fundierte Entscheidungen zu treffen. Mit diesem Blogbeitrag zeige ich die Vorteile und wesentlich Zusammenhänge auf.

Wenn ich nur wüsste….

Schön, dass Sie weiterlesen.  Aristoteles hat Neugier als Tugend verstanden. Im Privaten kennt man oft die intimsten Details über seine besten Freunde.  Aber wie sieht es im Geschäftsleben aus? Schauen wir uns ein Unternehmen an: Kennen Sie deren Strategie? Marktpositionierung? Eigentümer? aktuellen Herausforderungen? Und jetzt

Cloud – Fluch oder Segen?

Die Cloud wird sehr kontrovers diskutiert. Die Vorteile stehen für mich in dem Vordergrund. Mit diesem Blogpost zeige ich Ihnen warum.

Auf dem Weg in die AWS

Auf dem Weg in die AWS

AWS Cloud: Wir migrierten in 100 Tagen unseren 50 Systemen. Ich gebe Ihnen hier einen Einstieg, so lernen Sie die AWS Cloud kennen.

We need to talk

We need to talk!

First of all, a Happy and successful New Year to everyone.  I know, you are all busy with Year End Closing but “We need to talk!” and I will keep it short. Well, quite some of you will connect this expression with something negative.  I

Rapid changes in HR needed

COVID-19 is a typical Black Swan event. Nobody could foresee the global impact on our business and daily life. Rapid changes happened in HR but also other areas. We all struggle to get a clear picture about the future. Optimism helps and let us hope

Best Practice Dashboard with SAP Analytics Cloud (SAC)

My colleagues and myself have talked a lot about Data Warehousing, Analytics, Reporting, Predictive and Planning in previous blogs and in several Webinars so far this year. However, we have not touched Best Practice in Dashboarding with SAP Analytics Cloud (SAC). Regardless of the solution,

Integration von Machine Learning Pipelines in die SAP Systemlandschaft

Wie kann eine Machine Learning Pipeline mit einer graphischen Benutzeroberfläche in Ihrer SAP Systemlandschaft erstellt und voll-integriert angewendet werden? In diesem Blog-Beitrag zeige ich Ihnen wie es geht. Die Screenshots wurden im Rahmen eines Workshops bei der Swiss Data Science Conference 2020 mit SAP Data