Is Power BI the right front end tool for you and your users? Learn what Power BI can do and why companies use Power BI:
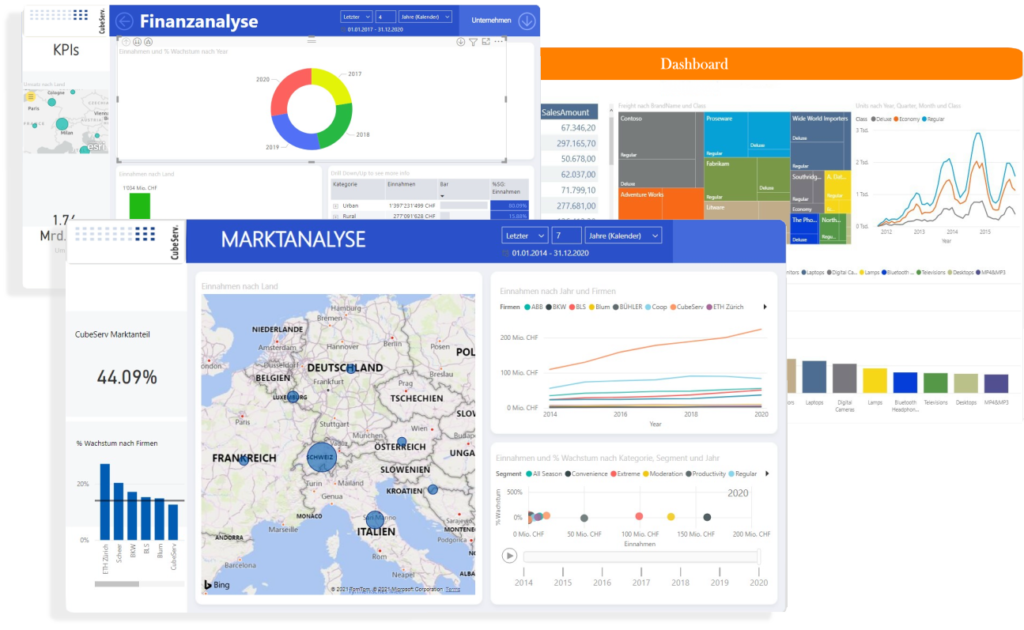
Good decisions require careful analysis of the situation and options for action. Dashboards and reports give everyone in the organization a common view.
Reporting is becoming smarter, more interactive, and real-time. Artificial intelligence in the form of machine learning is a key enabler of reporting.
Digital technologies will define reporting in the future. Alignment is moving in that direction:
-
- Interactive dashboards that query databases to retrieve information on demand are the ultimate self-service experience. You can dynamically view data and also customize it for easier understanding.
- Predictive analytics use algorithms to perform forward-looking data analysis, especially routine financial forecasting. Real-time reporting automates and streamlines all aspects of the reporting process.
- Artificial intelligence includes natural language tools that can read and write, as well as machine learning.
- Chatbots (virtual assistants) help you interact directly using voice or text queries.
- Cloud-based solutions are increasingly popular. By providing a single cloud-based data source for the entire organization, everyone is working from the same reliable starting point.

International standards in digital reporting
More and more companies are defining guidelines for the visualization of their data. The consistent design rules determine how quickly and error-free a report is read and understood. The user-friendly presentation of information in the form of text, tables and graphics gives the reader a quick and clear overview of the essentials.
In recent years, the amount of information has increased and become more fast-moving. The more complex the reports, the more likely the misinterpretation. To avoid such misunderstandings, standards for digital reporting have been defined for both subject-specific and general reports, e.g.:
IBCS – The International Business Communication Standards (IBCS®) are practical rules for designing reports, presentations, dashboards and the charts and tables they contain. We recommend our customers to consider using the extensions provided by our partner graphomate. With these extensions you can create tables and graphs in the same way (e.g. with SAP Analytics Cloud, Analysis for Office, SAP Lumira, Tableau …).
XBRL is the international standard for digital reporting of financial, performance, risk and compliance information.
The standard is supported by many service providers and is a freely licensed open technology committed to improving reporting.
Data visualization
Which technology or tools should be used for data visualization? The answer is not always clear. The current market offers the agony of choice. The offer ranges from well-known and popular tools to in-house development. If you decide on the right solution, you will save money and time.
In order to make the right choice, several questions should be answered. Here are some points from the list of questions:
- for what purposes will the reports be created? how large is the analysis data
- which database will be used for data storage and administration?
- may the data be stored in a cloud?
- which report formats are needed?
- how many users should have access from the reporting system?
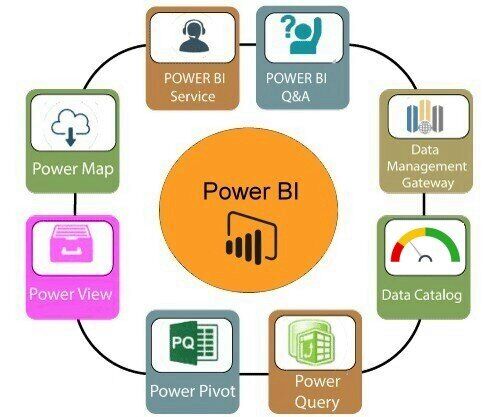
What is Power BI?
Microsoft Power BI is a collection of business intelligence (BI), reporting and data visualization products and services for individuals and teams. The value and versatility of the business analytics solution comes from how the individual elements are used and how they work together.

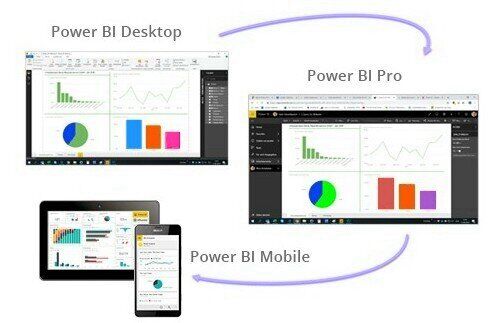
Power BI service
The Power BI service is a cloud service hosted by Microsoft that allows users to view dashboards, reports, and Power BI apps using a web browser or via mobile apps for Windows, iOS, and Android.
Power BI Desktop
Power BI Desktop is a free self-service data analysis and reporting tool that can be installed on a Windows computer and can connect to both local and cloud data sources.
With Power BI Desktop, you can:
- Connect to data.
- It can connect to more than 70 local and cloud data sources such as Azure (Azure Data Warehouse), DropBox, Google Analytics, OneDrive and SAP.
- Transform and model data
- Create reports and dashboards with charts, tables and graphs
- Share reports with others via the Power BI service
Why companies choose Microsoft Power BI:
It offers a quick start, uncomplicated setup, without training
Power BI makes it incredibly easy to bring your data together in one place. The drag-and-drop interface also means you don’t have to code or copy and paste anything to get started. You combine multiple files (such as Excel spreadsheets) and analyze the merged data in one report.

It is performant
Power BI’s Power Pivot data modeling engine is a powerful columnar database that uses advanced tabular database technologies to compress databases for the best possible performance. It is not uncommon for the Power BI workbook to be significantly smaller than the original datasets. In fact, 1 GB databases are typically compressed to a size of about 50 to 200 MB. Power BI optimized to handle tables with more than 100 million records without breaking a sweat. In short, Power BI efficiently compresses and loads millions of records into memory, allowing users to analyze data faster.
It has custom open source graphics
Power BI includes a lot of pre-built standard data that can be used in interactive reports such as bars, columns, lines, maps, matrices, pie charts, scatter plots, tables and waterfalls – of course with customization options for improved presentation and functionality. With custom visual files available from both Microsoft and the community on the “AppSource Marketplace”, there is an impressive selection of rich and complex visual files available. If one wants to present your data in a particular way, Power BI makes it easy to create custom graphics instead of sticking to the usual.
Advanced data scientists can use open source programming languages
Its core strength lies in its simplicity, but it is also aimed at advanced data experts. Open source programming languages such as R, Phyton, React are supported. Power BI is best suited for drilldowns and splitting data to better show relationships, metrics and hierarchies.
Integration in Excel
Advanced Excel users who are familiar with the Data Analysis Expressions (DAX) formula language can easily analyze and format their data with Power BI using its well-known Power Pivot functions such as clustering, forecasting, grouping. No need to export files to Excel: just click on “Analyze in Excel” and Power BI opens an interface very identical to Excel.
Optimized publishing and distribution via the Power BI service
Dashboards are updated in real time,
when data is transmitted or streamed. Sources for streaming data can be any: B. Internal resources, social media sources, etc.
Chatbots functionality
The tool works with Microsoft’s digital assistant, Cortana. Users can verbally ask questions in natural language to access charts and graphs. This can be especially helpful for users with mobile devices.
Artificial intelligence
Users can access image recognition and text analytics, build machine learning models, and integrate with Azure Machine Learning.
Which is the right front end tool for you and your users? We recommend that you update or work out your analytics strategy. Derived from this strategy, define the evaluation criteria and weights and evaluate the relevant tools together with us, as an experienced partner.
With our experience, we are happy to help you build a platform for good decisions. Contact us! Let the Business Analytics Platform inspire you.
We will highlight the different aspects of business analytics in this blog series.
Published so far:
- Part 1: How to make business analytics successful?
- Part 2: Business Analytics vs. Business Intelligence
- Part 3: What is SAP Analytics? The SAP Data Warehouse Portfolio
- Part 4: SAP Analytics – The Front End Products
- Part 5: Data Platform – An Important Pillar of Digital Transformation
- Part 6: On the Way to AWS
- Part 7: Cloud – Curse of Blessing?