Let's start with some day-dreaming !

Imagine
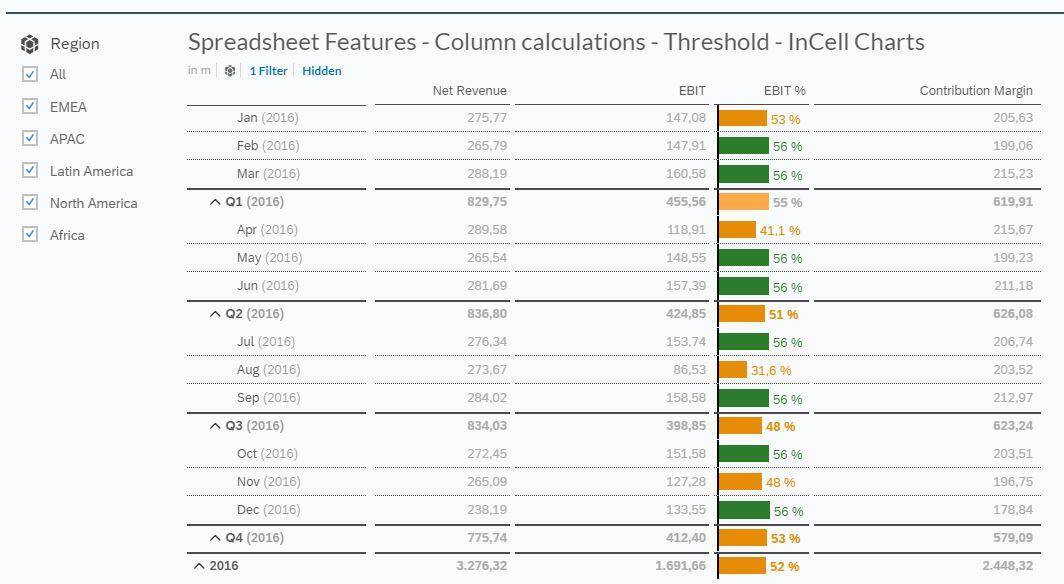
You get a push message telling you that the contribution margin for your top product range reaches a critical level!
Ok, I am sure your eyes are already open again. Fair enough, that is not a sensation and has been around for years.
Let’s try again.
Imagine
You get a push message telling you that the contribution margin for your top product range reaches a critical level!
BUT you also get additional insights into the root cause of this issue which enables you to take actions immediately.
Let’s try another case
You get an Excel Sheet from your colleague with lots of numbers in columns and rows but no insights whatsoever. Wouldn’t it be nice, just to upload it to your reporting tool and let the system generate a dashboard with insights, correlations and even simulation possibilities?
Now how does that sound? Interesting? Would you like to have that?
No problem, the tool is available. And yes, it does get even better: All of above is possible in the same solution, where you also build and manage your normal standard reporting, analyses, dashboard, predictive and planning.
Before we look at the solution, let us look at the expressions DEMOCRATIZE BI and AUGMENTED ANALYTICS
Democratize BI
Whenever a technology becomes more accessible and affordable, we can say that it has been “democratized”. The ability to access vast amounts of data in reasonable time and at reasonable cost is possible recently. Data Warehouses and a whole bunch of visualisation tools which rely heavily on IT enables us to have Reports, Analysis and Dashboard about anytime, anywhere and almost on any device.
However, there are major drawbacks:
- Business needs to specify the reports and kind of know beforehand, what kind of information they are looking for
- Changes, operation relies on the IT department
- System are not agile and often outdated
- Because of that a Tool Zoo is created and different tools might be needed to find the answers
Augmented Analytics
Gartner’s definition: “Augmented analytics is the use of enabling technologies such as machine learning and AI to assist with data preparation, insight generation and insight explanation to augment how people explore and analyze data in analytics and BI platforms.”
Conclusion:
In order to really be enabled and empowered, business needs a tool which combines the promises of DEMOCRATIZE BI and AUGMENTED ANALYTICS.
For a long time however, there was a lack of of the right tool. But not anymore. SAP Analytics Cloud is the only available cloud-based solution for Analytics, Reporting, Planning, AI & Predictive capability with vast Features and Functions. Built with the Business User as a creator of the Reporting, Dashboard, Planning and Predictive Scenarios in mind without the need to have IT and/or Data Science experts. SAP Analytics Cloud is the strategic solutions by SAP and therefore a safe investment.
- Same Touch and Feel regardless of the capability
- Basically Zero-effort for End-User Training
- Leverage investments made in SAP HANA, SAP Business Warehouse
- Open to almost any data sources, no need to have any SAP data source
- Fast Set up, no Hardware needed
- Scalable from a few users to a global enterprise roll-out
- Subscription based
- Continuous roll out of new functions and features based on a huge development roadmap
Therefore to implement and make use of tools like the SAP Analytics Cloud will lead to the democratization of business intelligence technology.
If we want to address the examples at the beginning, we will make use of the Augmented Analytics features of the SAP Analytics Cloud:

Augmented Analytics is an important and growing part of the SAP Analytics Cloud and currently consists of
- Smart Predict, accessible Artificial Intelligence, no need to be a Data Scientist
- Search to Insight: Faster Answers, Derived Naturally
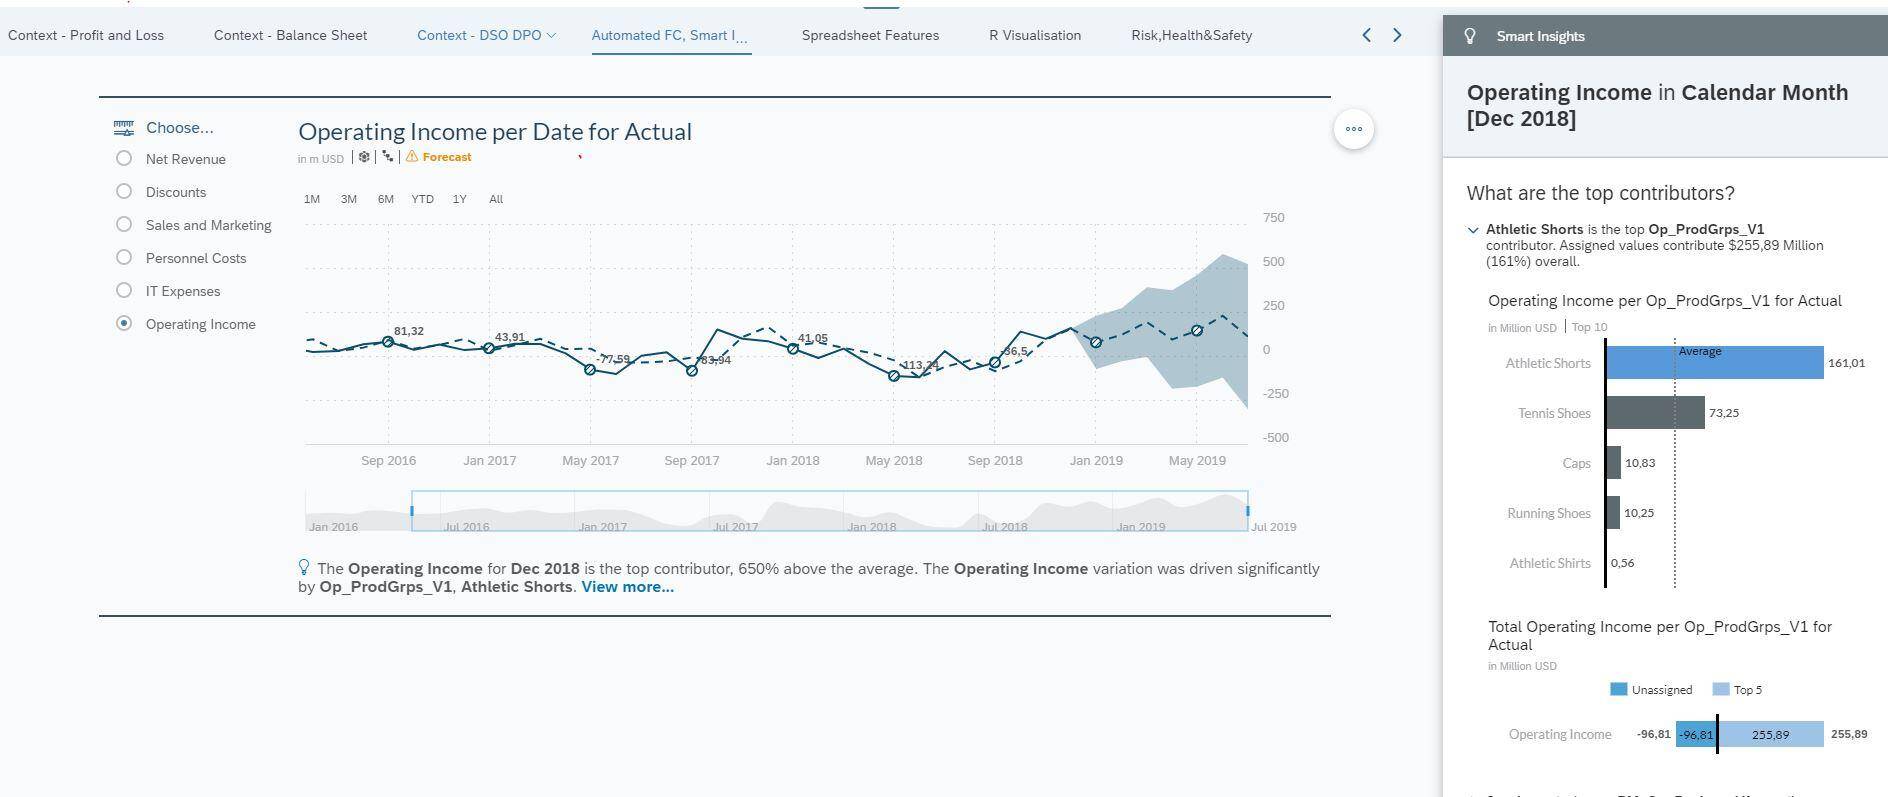
- Smart Insights: Explain Anything with a Single Click
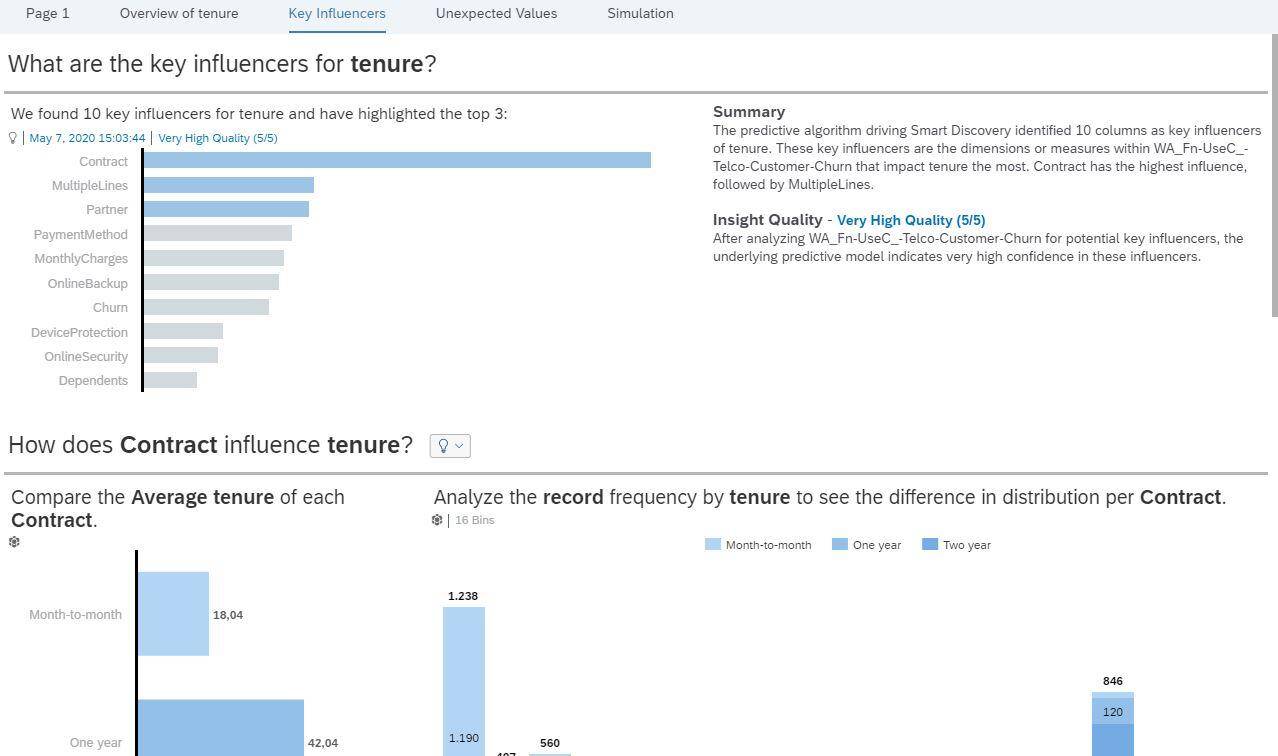
- Smart Discovery: Jumpstart Data Exploration with Automated Story Creation
Join our next Webinar and see for yourself live how all of above works and how it can bring added value to your daily work.
- 14th May 2020 – 10.00 hrs – Introduction; Dashboards, Augmented Analytics and Planning
- 27th May 2020 – 15.00 hrs – Augmented Analytics – DEMOCRATIZE BI
- 18th June 2020 – 10.00 hrs – Simplify Planning & Scenario-based forecasting with one cloud solution
The Webinars audience are the Finance and Controlling teams. It will always include Live Demos and be held in English.
Duration: approx. 45 min, all times are CEST.
We are looking forward to get in touch with you.