CubeServ Blog
Bleiben Sie auf dem neuesten Stand, rund um das Data Driven Business mit Tools für Analytics von SAP & Co. und verpassen Sie keine Neuigkeiten, Downloads & Veranstaltungen.

Augmented Analytics – Democratize BI – A Dream come true?

Let's start with some day-dreaming !

Lake of Zug

Imagine

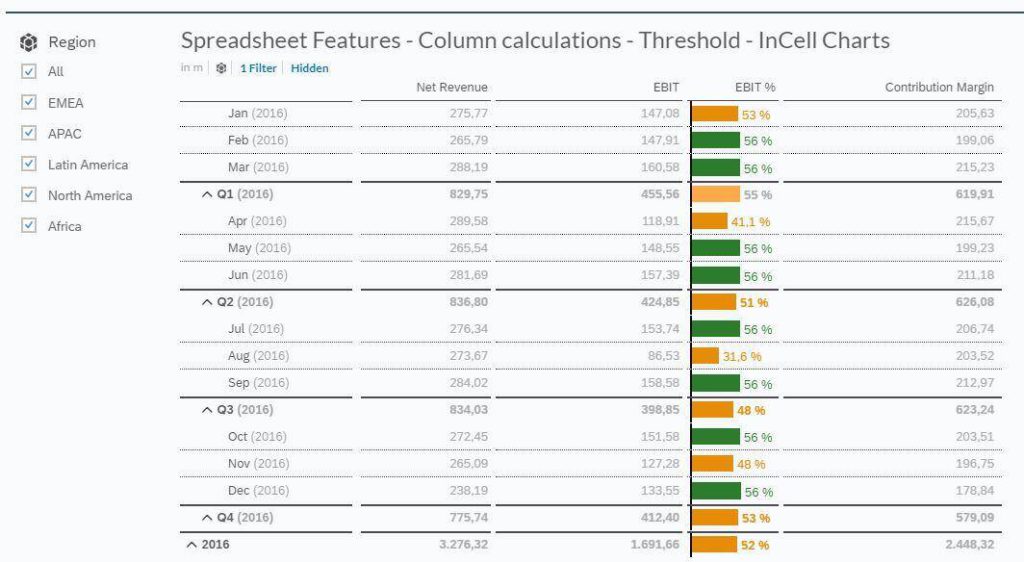
You get a push message telling you that the contribution margin for your top product range reaches a critical level!

Ok, I am sure your eyes are already open again. Fair enough, that is not a sensation and has been around for years. 

Let’s try again.

Imagine

You get a push message telling you that the contribution margin for your top product range reaches a critical level!

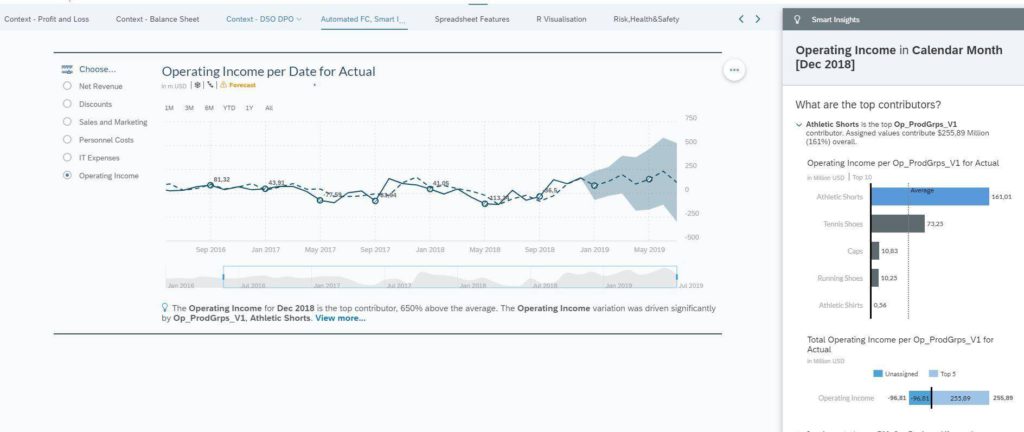
BUT you also get additional insights into the root cause of this issue which enables you to take actions immediately.

Let’s try another case

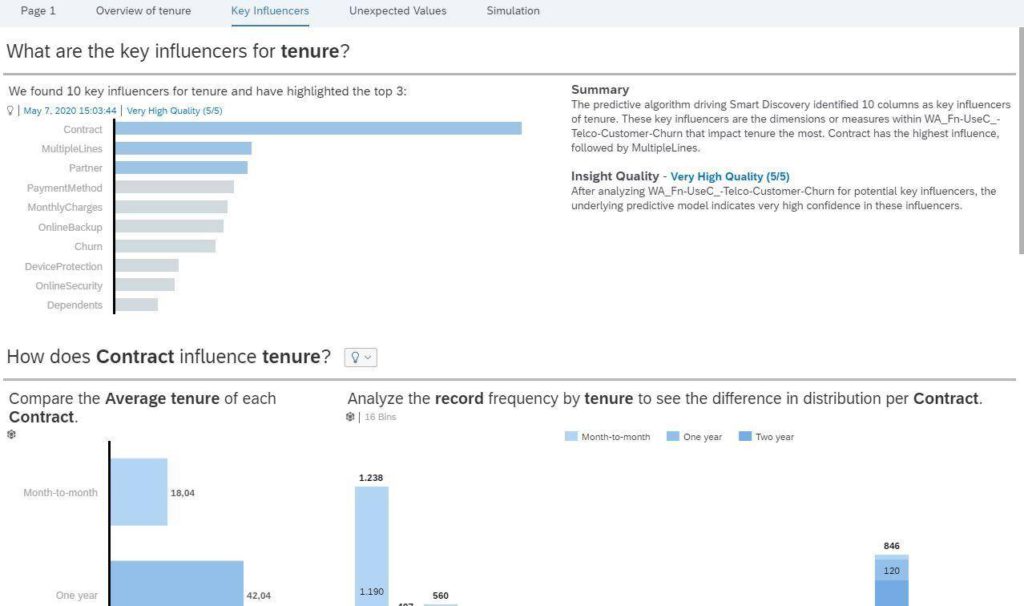
You get an Excel Sheet from your colleague with lots of numbers in columns and rows but no insights whatsoever. Wouldn’t it be nice, just to upload it to your reporting tool and let the system generate a dashboard with insights, correlations and even simulation possibilities?

Now how does that sound? Interesting? Would you like to have that? 

No problem, the tool is available. And yes, it does get even better: All of above is possible in the same solution, where you also build and manage your normal standard reporting, analyses, dashboard, predictive and planning.

Before we look at the solution, let us look at the expressions DEMOCRATIZE BI and AUGMENTED ANALYTICS

Democratize BI

Whenever a technology becomes more accessible and affordable, we can say that it has been “democratized”. The ability to access vast amounts of data in reasonable time and at reasonable cost is possible recently. Data Warehouses and a whole bunch of visualisation tools which rely heavily on IT enables us to have Reports, Analysis and Dashboard about anytime, anywhere and almost on any device.

However, there are major drawbacks:

  • Business needs to specify the reports and kind of know beforehand, what kind of information they are looking for
  • Changes, operation relies on the IT department
  • System are not agile and often outdated
  • Because of that a Tool Zoo is created and different tools might be needed to find the answers

Augmented Analytics

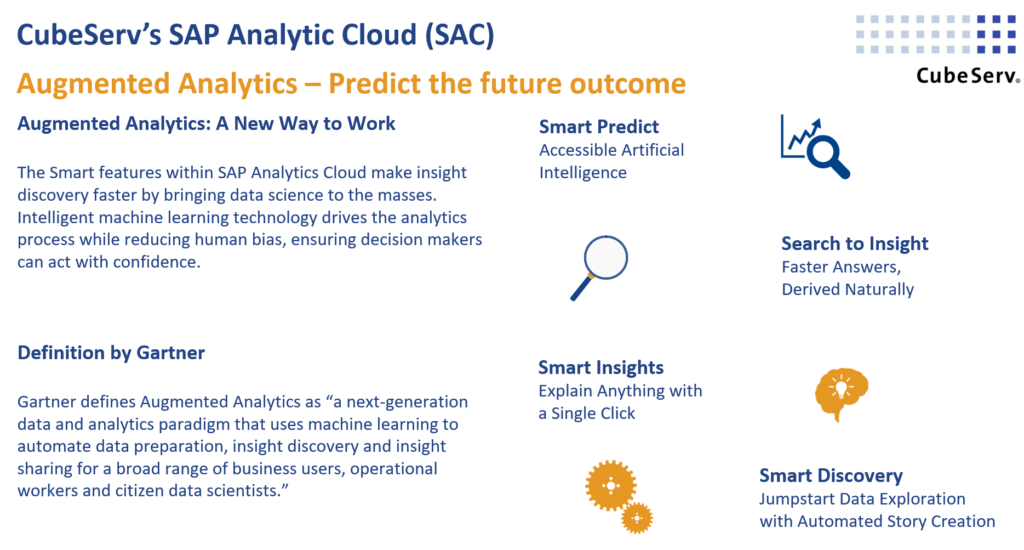
Gartner’s definition: „Augmented analytics is the use of enabling technologies such as machine learning and AI to assist with data preparation, insight generation and insight explanation to augment how people explore and analyze data in analytics and BI platforms.“

Conclusion:

In order to really be enabled and empowered, business needs a tool which combines the promises of DEMOCRATIZE BI and AUGMENTED ANALYTICS.

For a long time however, there was a lack of of the right tool. But not anymore.  SAP Analytics Cloud is the only available cloud-based solution for Analytics, Reporting, Planning, AI & Predictive capability with vast Features and Functions. Built with the Business User as a creator of the Reporting, Dashboard, Planning and Predictive Scenarios in mind without the need to have IT and/or Data Science experts. SAP Analytics Cloud is the strategic solutions by SAP and therefore a safe investment.

  • Same Touch and Feel regardless of the capability
  • Basically Zero-effort for End-User Training
  • Leverage investments made in SAP HANA, SAP Business Warehouse
  • Open to almost any data sources, no need to have any SAP data source
  • Fast Set up, no Hardware needed
  • Scalable from a few users to a global enterprise roll-out
  • Subscription based
  • Continuous roll out of new functions and features based on a huge development roadmap

Therefore to implement and make use of tools like the SAP Analytics Cloud will lead to the democratization of business intelligence technology.
If we want to address the examples at the beginning, we will make use of the Augmented Analytics features of the SAP Analytics Cloud:

Sie sehen gerade einen Platzhalterinhalt von Youtube. Um auf den eigentlichen Inhalt zuzugreifen, klicken Sie auf die Schaltfläche unten. Bitte beachten Sie, dass dabei Daten an Drittanbieter weitergegeben werden.

Mehr Informationen

Augmented Analytics is an important and growing part of the SAP Analytics Cloud and currently consists of

  • Smart Predict, accessible Artificial Intelligence, no need to be a Data Scientist
  • Search to Insight: Faster Answers, Derived Naturally
  • Smart Insights: Explain Anything with a Single Click
  • Smart Discovery: Jumpstart Data Exploration with Automated Story Creation

Join our next Webinar and see for yourself live how all of above works and how it can bring added value to your daily work.

The Webinars audience are the Finance and Controlling teams. It will always include Live Demos and be held in English. 

Duration: approx. 45 min, all times are CEST.

We are looking forward to get in touch with you. 
Newsletter abonnieren

Bleiben Sie auf dem neuesten Stand, rund um das Data Driven Business mit Tools für Analytics von SAP & Co. und verpassen Sie keine Neuigkeiten, Downloads & Veranstaltungen. 

Autor
Expert Team

Blog Artikel unserer Experten

SAC Numeric Point Chart mit Trendvisualisierung

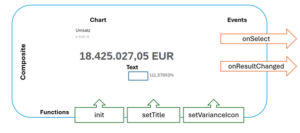
In diesem Beitrag konzentrieren wir uns auf die neuen Möglichkeiten, die das QRC2 Release für die Verwendung von Composites bietet. Als Beispiel wollen wir das SAC Numeric Point Chart erweitern. Es wird verwendet, um eine Kennzahl und optional eine Abweichung darzustellen. Beispielsweise kann der Umsatz und dessen Abweichung zum Vorjahr darstellt werden.

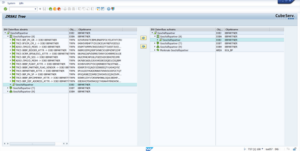
RSA1 nicht mehr verfügbar: Transaktion ZRSA1 jetzt kostenlos downloaden!

Composites bieten die Möglichkeit, aus bestehenden Widgets eigene Komponenten zu erstellen. Dieses Feature ist bereits aus SAP Lumira bekannt und wird beispielsweise für Corporate Header, eigene Seitennavigation oder vordefinierte Charts verwendet. Composites werden im File Repository abgelegt und können dann in Stories verwendet werden.

Custom Page Navigation mit SAC Composites

Composites bieten die Möglichkeit, aus bestehenden Widgets eigene Komponenten zu erstellen. Dieses Feature ist bereits aus SAP Lumira bekannt und wird beispielsweise für Corporate Header, eigene Seitennavigation oder vordefinierte Charts verwendet. Composites werden im File Repository abgelegt und können dann in Stories verwendet werden.

Moderne Planung mit SAP Datasphere und SAP Analytics Cloud

Wie funktioniert Planung mit SAP Datasphere und SAP Analytics Cloud (SAC)? SAP Datasphere (DSP) und SAP Analytics Cloud (SAC) sind zwei leistungsstarke Tools, die Ihnen helfen können, Ihre Prozesse zu optimieren. In diesem Kontext werden wir von unseren Kunden aber auch immer häufiger über die

SAP Integration in Azure Data Factory mit CDC

Die Azure Data Factory ist ein cloudbasierter, codefreier ETL- und Datenintegrationsservice von Microsoft, der als Platform-as-a-Service (PaaS) fungiert. Ihr Schwerpunkt liegt auf der nahtlosen Integration von Daten aus vielfältigen Quellen in einem zentralisierten Datenspeicher in der Cloud. Dies ermöglicht eine effiziente Verwaltung und Analyse der

CubeServ Group & Pyramid Analytics

CubeServ Group & Pyramid Analytics
Seit Juli 2023 ist die CubeServ Group Partner für die Konzeption und Implementierung der Pyramid Decision Intelligence Platform. Lesen Sie meinen Blog und finden Sie die Beweggründe für diese Partnerschaft heraus und wieso diese Partnerschaft auch für Sie von Vorteil sein kann.

Berichte im eigenen Design

Erstellen Sie SAP-Berichte in Ihrem Design

In SAP Analytics Cloud (SAC) gibt es diverse grafische Elemente, mit deren Hilfe Sie Daten verständlich darstellen können. Wie Sie eigene Grafikelemente in SAC integrieren und ihrem Design anpassen, zeigt unser Schulungsvideo.

openSAP Podcast – Die intelligente Personalplanung im Krankenhaus

Podcast der SAP mit Johannes Kumpf, Business Development Manager HR Solutions & Daniel Schneider, Management Consultant und Healthcare-Experte – beide bei der CubeServ GmbH. Eine detaillierte und zuverlässige Personalplanung ist in Zeiten von personellen Engpässen wichtiger denn je. Hierbei spielen Business Intelligence und Data Warehousing

CubeServ INSIDE LOOK 08/21

In der Situation einer komplexen Krise benötigen Unternehmen Sicherheit um ihre Ziele zu erreichen und die Fähigkeit sich schnell anzupassen.

circular-barplot-with-groups

Advanced Analytics mit SAP und R

Warum sich mit der SAP R-Integration beschäftigen? Die überwiegende Mehrheit der Unternehmen nutzt fortschrittliche Analysen mit R- und SAP-Tools, um zukünftige Ereignisse zu prognostizieren und datengestützte, fundierte Entscheidungen zu treffen. Mit diesem Blogbeitrag zeige ich die Vorteile und wesentlich Zusammenhänge auf.

Wenn ich nur wüsste….

Schön, dass Sie weiterlesen.  Aristoteles hat Neugier als Tugend verstanden. Im Privaten kennt man oft die intimsten Details über seine besten Freunde.  Aber wie sieht es im Geschäftsleben aus? Schauen wir uns ein Unternehmen an: Kennen Sie deren Strategie? Marktpositionierung? Eigentümer? aktuellen Herausforderungen? Und jetzt

Cloud – Fluch oder Segen?

Die Cloud wird sehr kontrovers diskutiert. Die Vorteile stehen für mich in dem Vordergrund. Mit diesem Blogpost zeige ich Ihnen warum.