With Data Warehouse Cloud version 2020.14, SAP has enabled the integration of time dimensions.
Why is the time dimension so important?
Previously, many aggregation levels of a date column were required in the data to be loaded for SAP Data Warehouse Cloud, e.g. for a separate “Quarter” or “Year” column when multiple levels of time aggregation were required in the story.
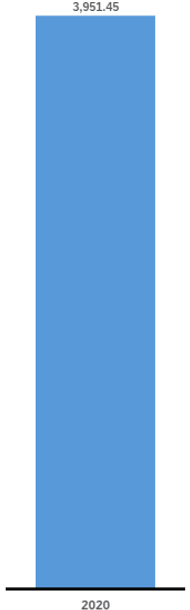
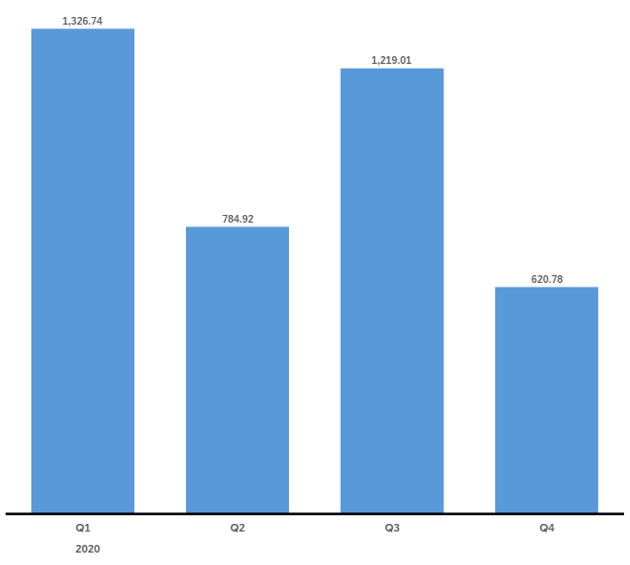
Some of us are used to SAP BW, where the single date field can be used not only for the corresponding date field in the target object but also for other date fields such as quarter and year. This automation is now also possible in the SAP Data Warehouse Cloud. With only one date field, you can also filter to other date levels in the story when making use of the new time dimension. It automatically redirects the “day” information to the year, quarter and month, and also offers predefined levels of time hierarchies that can be selected in story mode.
Access to the time dimension
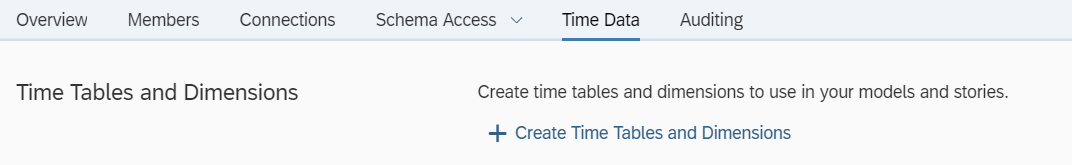
To take advantage of the convenience of automatically generated timelines, you must first add the timetables and their dimensions. This setting is done at the space level and not for the whole DWC.
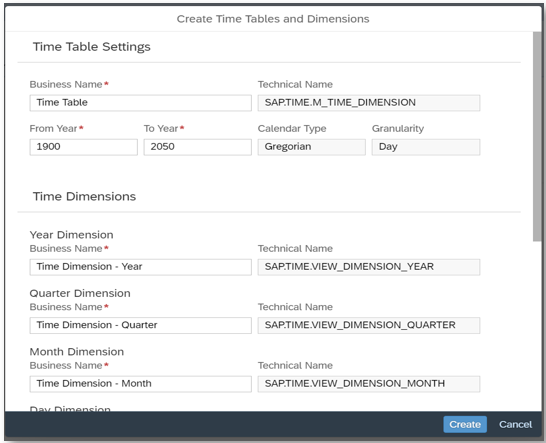
Clicking on the “Create Time Tables and Dimensions” button opens a dialogue box which objects the DWC creates:
- Time table (contains the time data)
- Time dimensions (year, quarter, month, day)
- Translation tables (en, de, fr, es)
The time tables and dimensions are now generated and can be integrated into the model. To do this, go to an existing analytical data set or upload new data to the DWC.
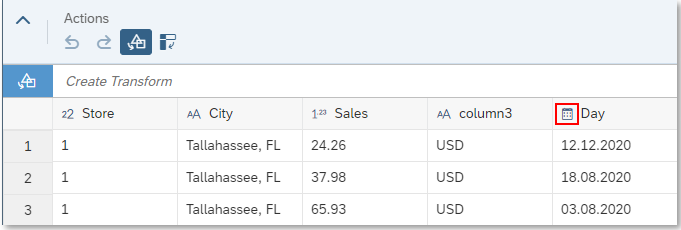
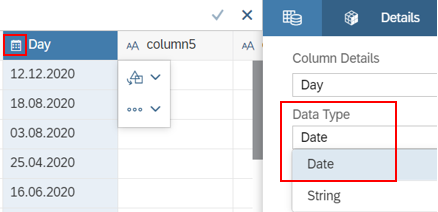
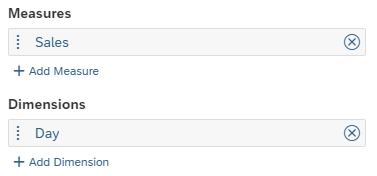
In my case, I started from scratch and uploaded a CSV file via Data Builder. The file contains a column called “Day”, which was already recognized in the DWC with the correct data type “Date”.
You have to make sure that the date column is of date data type and not of string type. Otherwise, it will not work.
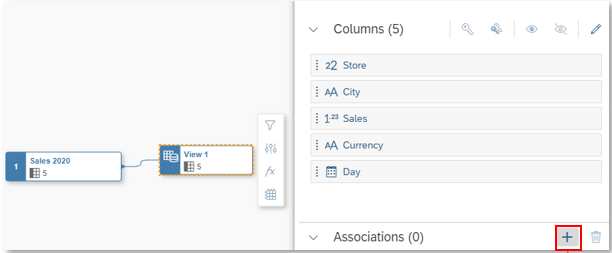
After the table has been loaded into the DWC via Deploy, a new view is created in the Data Builder. The table just loaded can be added to the canvas via drag & drop.
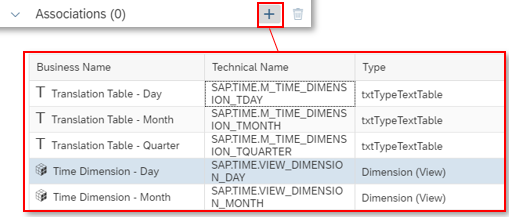
If you now click on the view, you can associate the appropriate time dimension in the settings. I took the dimension Day because my dataset had a date column.
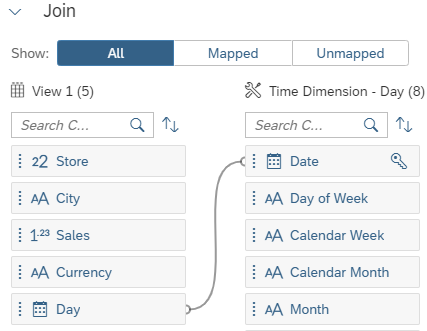
A new view opens. Here the DWC wants to know which column of the table should be associated with the new time dimension. Using drag & drop, the “Day” column can be associated with the “Date” dimension.
All necessary settings in the model are now done, so you can continue with the story.
Again, I would like to mention that the data type should be “Date”.
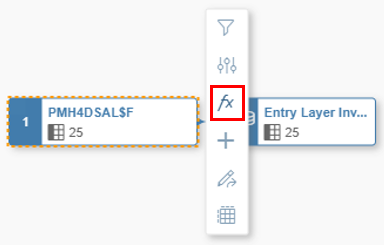
For this case, a calculated column must be added first, which converts the data type string into a date data type (current workaround).
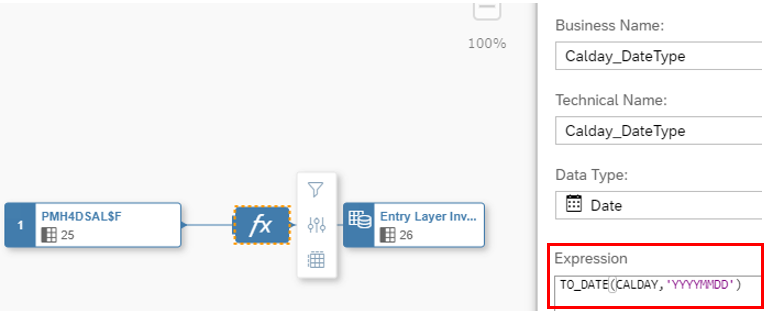
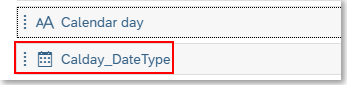
With a click on the remote table, you add a calculated column. It should contain the formula ” TO_DATE(,’YYYYMMDD’) “, which provides for the data type conversion string to date.
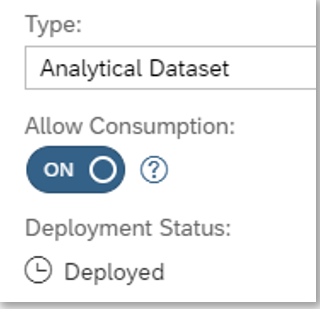
Attention: The association to the time dimension must be done on the level of the analytic dataset – not on the level of the input view of the table. Therefore, in my example, I have changed the view to an analytical dataset.
Story building
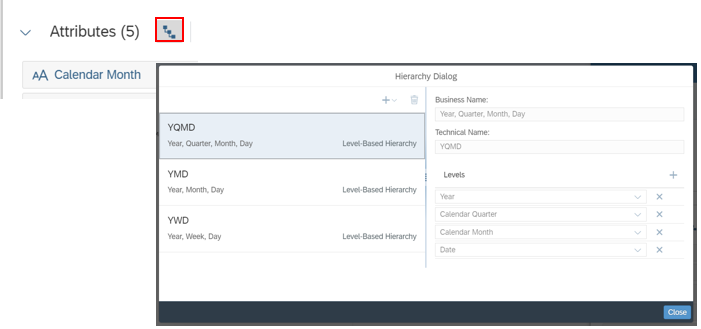
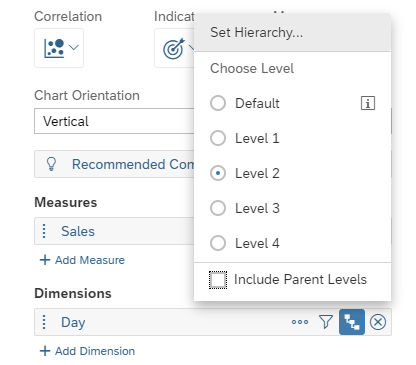
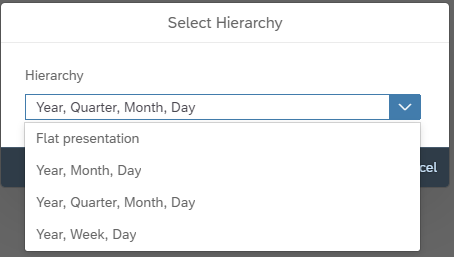
If you move the mouse over the date dimension, you will see that a hierarchy is now available. By clicking on the stair symbol and then on “Set Hierarchy…” you can select the desired hierarchy.
The hierarchies available for selection are the predefined hierarchies in the time dimension Day shown in the input.
We at CubeServ have already written various articles on this topic, and gained further insight into the SAP Data Warehouse Cloud with the following links.
- Blog: The SAP Data Warehouse Cloud - A New Big (?) Throw (Part 1)
- Blog: The SAP Data Warehouse Cloud - A New Big (?) Throw (Part 2)
- Blog: SAP Data Warehouse Cloud - Experiences in building a data model.
- Website: SAP Data Warehouse Cloud
- Webinar: Data Warehouse Cloud & Co. - The Agile Part of the Business Analytics Platform
Arrange now your Expert Call. We are looking forward to your message.