The concept of a business analytics platform is that it helps you organize your data so everyone can use it. It forms the basis for a uniform understanding of underlying events and processes. We create the platform for you to manage your company or organization in a fact-based and successful way.
Extracting value from information is not primarily a question of the amount of data. Rather, it’s about the way you use that data. This is the deciding factor of success. Remember, it is not the amount of data or the technology used that differentiates the approach.
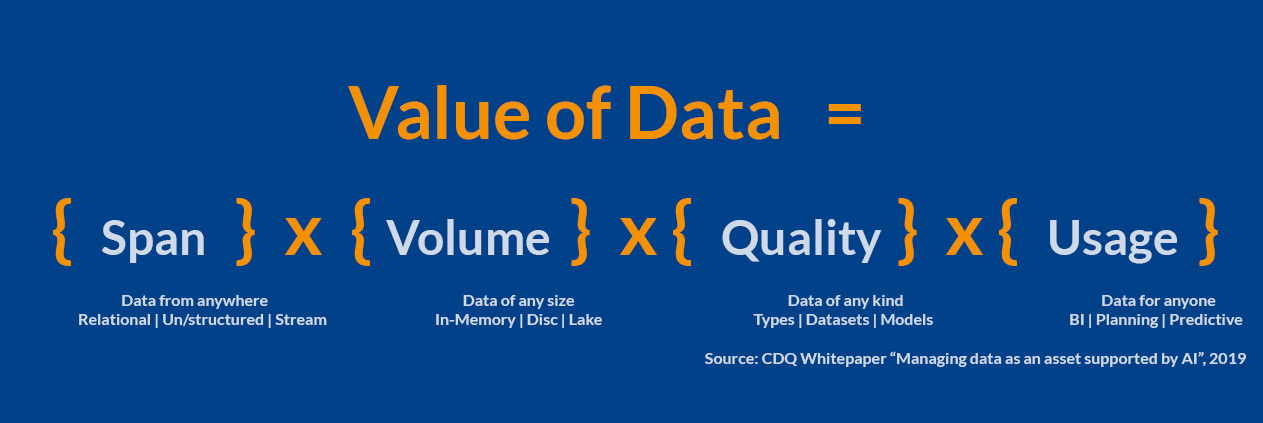
Even the best companies in analytics don’t always use the latest tools. However, they benefit from building their strategies and business models around their analytical capabilities. Individuals who believe that facts are the best guides for decisions and actions lead such companies. They make data and analytics integral parts of their corporate culture.
Analytics 1.0 was (or is, you should still be using it) heavily focused on descriptive analytics, ie, reports and visuals that explain what happened in the past. We don’t use analytics to look into the future (predictive analytics) or make recommendations on how to do a particular task better (prescriptive analytics). In the past decade, we’ve spent a lot of time encouraging companies to go beyond purely descriptive analytics.
Closer to the customer with insights
Successful companies work in a customer-oriented manner. We can master the challenges associated with today’s rapidly changing needs of customers and their buying habits by processing corresponding signals in a targeted manner.
Although many companies today generally have large amounts of customer information at their disposal, data analysis is often neglected or only carried out in a rudimentary manner.
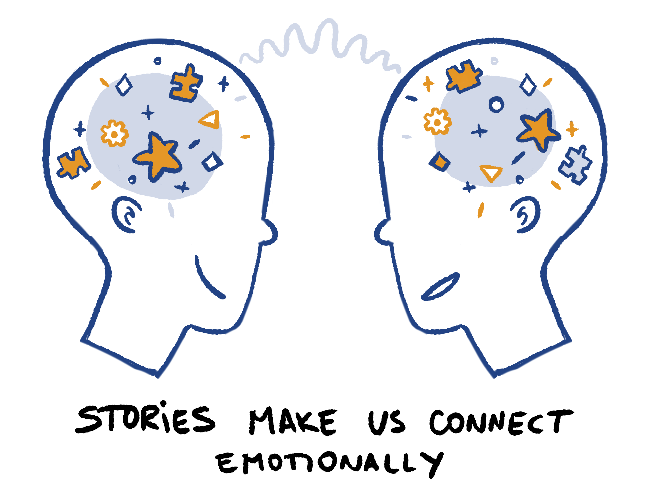
Stories engage the brain on all levels: intuitive, optional, rational, and physically. When we hear stories, our brains respond by better understanding the information. The limbic system (the emotional part of the brain) releases chemicals that stimulate our sense of connection and our reward centre.
When you put your audience at the centre of your story, you make them feel like heroes. Stories move us to action. The reactions our brains trigger may evoke a sense of empathy, urgency, or great concern.
In one study, participants’ neural responses were measured while listening to a story about a father’s relationship with his young, dying son. Two emotions, in particular, were prominent: distress and empathy. Study leaders assessed participants both before and after listening to the story. They found increased levels of cortisol, which makes a person more focused and attentive, and oxytocin, which triggers well-being and empathy. The most startling finding was: Narratives change the chemistry in our brains and get us to act. Captivating stories cause us to become emotionally attached to others and feel motivated to begin a particular action.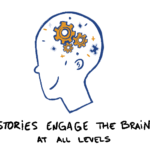
Design stories
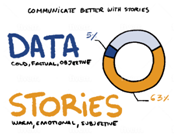
We use data to communicate in order to lead. There is a non-stop buzz about data: Big Data, Small Data, Deep Data, Thick Data, and machines that learn to analyze data. Many organizations are developing innovative things to improve our lives. At the centre of it all is—you guessed it—data. Of course, not all answers to organizational problems or opportunities will spring from an algorithm. Data is limited to recording the past by cataloging numerical artifacts of what has happened.
The search for historical truth is critical to decision-making; those who work with data are truth-seekers by nature. However, as you grow into a leadership position, you will spend most of your time communicating with others about the future you want to create.
Communicating data shapes our future truth – our facts. Communicating well is central to shaping the future in which people and organizations are meant to thrive. Insights from the past give us both the direction to go and the actions to take. Getting others to move forward with those measures, however, is only possible with good communication.
Lead with data
Cole Nussbaumer Knaflic recommends six simple steps in “Storytelling with Data“:
- Understand context
- Choose an appropriate visual representation
- Remove clutter
- Direct attention in the desired direction
- Think like a designer
- Tell a story
When we tailor our message to the recipients, we trigger the desired actions. It’s what resonates with the recipient that counts.
The best speakers present data in a concise and structured way. At the same time, they tell a compelling and memorable story. In our presentations, we direct
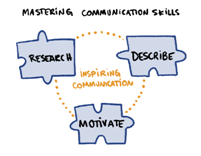
we deliberately capture the audience’s attention by focusing on our results and creating visual and verbal clarity. For me, it is important to communicate in an efficient and inspiring way. For this, the right amount of information is critical.
The six steps to a clear story are easy for anyone to apply. Given the diversity of data types and the different methods used by users, I am convinced that in most cases we need to combine different approaches (technologies and products) to achieve outstanding results and a high level of acceptance within the company. The key is to find the right level of diversity and standardization. Neither a single program nor a Tool-Zoo (a different program for every user) is a good solution in my eyes. Every company has different needs and should develop individual and adequate approaches.
We at CubeServ are specialized in adapting to the different requirements, developing alternative solutions and evaluating them together with the users.
Four Megatrends for the Future
=> AI Platforms as a Service
If artificial intelligence (AI) sounded like dreams of the future a few years ago, today it comes along rather inconspicuously and creeps secretly, silently into our everyday lives. Many people are not aware that they use AI tools on a daily basis. Voice-based assistants such as Alexa, Siri or Google Assistant are taken for granted by many. Yet the smart assistants are constantly learning through machine learning and are continuously improving; they interpret concerns correctly and react accordingly.
=> IoT platforms and blockchain
The Netzwoche headlined: “The Cloud – Door to the Internet of Things”. The Internet of Things (IoT) is emerging as more and more “objects” are connected to the Internet and send “object data” to the Internet. To make this possible, “sensors” are needed that capture the object data and transmit it wired or wirelessly to the Internet. The industry estimates that by 2020, 50 billion objects worldwide will be connected to the Internet; objects that send data that needs to be stored so it can be analyzed. For the exponentially growing flood of data (Big Data), the cloud serves as storage. Cloud-ready applications are also needed for data analysis.
=> Smart Workplaces & Streaming Analytics
Organizations recognized during the crisis that they needed to develop digital resilience across the workforce both after COVID-19 and during the crisis. In fact, it was this scramble to build technology stacks during the pandemic that led to the development of what Gartner describes as the “Smart Workplace.”
=> Always be available via cloud platforms
“Cloud computing” is the on-demand provision of IT resources over the Internet at usage-based prices. Instead of owning and maintaining physical data centers and servers, you can access technology services such as computing power, storage and databases on demand via a cloud provider such as Amazon Web Services (AWS).
The platform idea
Companies and people are under pressure to act. Changing framework conditions force rapid changes. The business analytics platform is the starting point for coping with new data types and combinations. We are constantly gaining new insights; proactively preparing options for the unknown.
Existing business models are better understood and optimized with new types of data.
The potential of digital service is recognized early and new customer benefits are generated.
Why the data warehouse is the core of the platform
Single Source of Truth (SSOT) is a concept that ensures that every business decision made in an organization is based on the same data. To set up an SSOT, relevant employees are equipped with a source that stores the data points they need. Data-driven decision-making took on unprecedented importance with the collection and analysis of data. Acting on data-driven business intelligence is essential for competitive brands today. Companies often spend far too much time debating which numbers (invariably coming from different sources) are the correct numbers.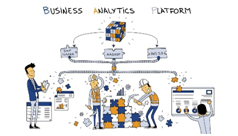
Establishing a single source of truth eliminates this problem. Instead of debating competing data sources to use for business decisions, everyone can use the same, unified source for their data needs.
It provides data that can be used by anyone, in any way, across the enterprise.
In addition to the data, the SAP applications use metadata (hierarchies, attributes, multilingualism, conversions) to ensure that the data can be interpreted correctly. Thus, S/4HANA, BW/4HANA and the data warehouse cloud are important building blocks of an analytical platform.
In addition to traditional business data (FI/CO, SD, etc.), new data types (social media, images, sounds, etc.) play a major role in analytical issues. They can be stored and analyzed better and more cost-effectively in special technologies. The analytical platform must be supplemented (object storage, Hadoop, etc.).
The data requirements in the Enterprise Data Warehouse are high. Therefore, changes to the structures or the load runs cause high costs. Users often do not need this high quality for prototypes etc., but flexible structures. The analytical platform must be supplemented with a Data Warehouse Cloud and with local structures.
Analytical issues are addressed with new methods: therefore it is important to integrate open (OpenSource: R and Python) and convenient applications
(Process mining like Celonis, PowerBI and/or Tableau) into the platform.

SAP Reference: Business Technology Platform
Reference architecture for a digital transformation-
- Development of a fully integrated self-service and advanced analytics platform for all interactions and user groups.
- This serves as a framework with application and infrastructure services for converting different types of data and integrating different interfaces, source and target systems.
- Agility through coupling of different information systems in a logical data warehouse with Realtime Data Warehouse & Analytics Lab.
- Agile real-time data management with structured business data and unstructured Big Data from the Data Lake. Users leverage agile data from multiple sources. SAP HANA connects operational and analytical systems on one platform.
• SAP S/4HANA forms the “digital core” for embedded operational reporting.
• SAP BW/4HANA as “central DWH” for descriptive and predictive analytics—with data types from IoT and Data Lakes. SAP Data Warehouse Cloud complements the core system as a “digital framework.”
The data in SAP S/4HANA is not sufficient for many scenarios. We ensure data protection by taking this into account when designing business analytics and data governance.
Building Blocks of the Business Analytics Platform
The concept of cheap blocks is used in the Enterprise Architecture Framework TOGAF. The following solution components have a more general application character, i.e., they can be used as templates to solve similar problems. Building blocks have the following generic properties:- A brick is a set of functions defined to meet business needs in an organization.
- A brick has published interfaces for accessing functionality.
- A brick can interact with other interdependent modules.
- Build an end-to-end integrated self-service and advanced analytics platform for all interactions and user groups.
- This serves as a framework with application and infrastructure services for the conversion of various data types and the integration of diverse interfaces, source and target systems.
- Agility through coupling of diverse information systems in a logical data warehouse with Realtime Data Warehouse & Analytics Lab.
- Agile real-time data management with structured business data and unstructured Big Data from the Data Lake. Users use agile data from different sources. SAP HANA combines operational and analytical systems into one platform.
- SAP S/4HANA forms the “digital core” for embedded operational reporting.
- SAP BW/4HANA as “central DWH” for descriptive and predictive analysis -with data types from IoT and Data Lakes. SAP Data Warehouse Cloud complements the core system as a “digital framework”..
A building block is a defined set of functionality to meet specific business requirements. The organization sets the way functionality, products, and custom development are assembled into building blocks and will vary widely across architectures.
Each organization decides which arrangement of building blocks works best for them. Appropriate selection of building blocks can lead to improvements in integration of legacy systems, interoperability, and flexibility in creating new systems and applications.
Systems are made up of collections of building blocks; there is a need for most building blocks to interact with other building blocks.
In this case, it is important to publish the approximate stable interfaces to a building block.
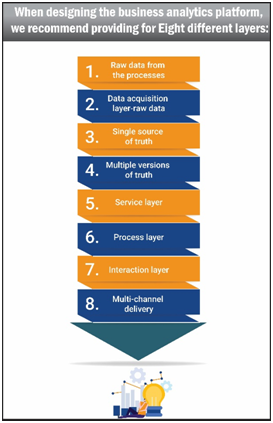
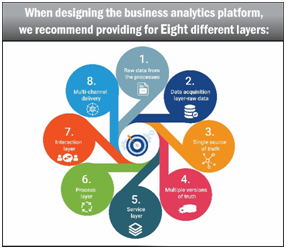
We recommend providing for eight different layers when designing the business analytics platform:
- Raw Data from Processes
- Data acquisition layer-raw data
- Single Source of Truth
- Multiple Versions of Truth
- Service Layer
- Process Layer
- Interaction Layer
- Multi Channel Delivery
Virtually Connect Databases and SAP Systems Based on SAP HANA
A wide variety of technologies are combined on SAP HANA for data storage. It is recommended for regular use within the SAP HANA stack to model the data that the transfer to SAP HANA is reduced to a minimum. This is different for exploratory access; here longer processing times are acceptable due to infrequent access. For the integration of the various other technologies, Smart Data Access (SDA) and Smart Data Integration (SDI) in particular are available at the SAP HANA level. With SDA or SDI, data can be merged into heterogeneous enterprise data warehouse landscapes (data federation) and combined for analysis. In previous SAP tools, all data were pre-classified by storing them in a database. In contrast, SDA lets you access data remotely without first replicating the data in the SAP HANA database. SDA is used for Teradata databases, SAP Sybase ASE, SAP IQ, Intel Distribution for Apache Hadoop and SAP HANA instances, among others. SAP HANA processes the data like local tables in the database. Thanks to automatic data type conversion, it is possible to map data types from databases that are connected to SAP HANA data types via SDA. With SDA, data from other sources remains in virtual tables. Virtual tables created within SAP HANA reference remote tables in the designated data sources. These connections provide real-time access to the data, regardless of where it is stored. At the same time, they do not affect the SAP HANA database. Authorized users can subsequently write SQL queries to SAP HANA that operate on virtual tables. The SAP HANA query processor optimizes the queries and executes the relevant part of the queries in the connected database, returns the result to SAP HANA and completes the operation. Query execution is optimized with SDI or SDA by working with SQL queries on virtual tables in SAP HANA. To create relationships and links, connect facts and master data from the source via associations in Open ODS View. These facts and master data, as well as operations on navigation attributes, are linked directly at the database level at query runtime. For Open ODS Views, SDA lets you use data sources not managed by the SAP BW system, but without much effort: extend modelling in the SAP BW system, use persistent data stored in SAP HANA tables, and create an open ETL connection between external systems and your virtual tables. Through this, with raw data from the processes, the first layer can be modelled. Not all data can be accessed virtually. Thus, we need a place in the business analytics platform where such data is stored: Data Acquisition Layer Raw Data.
Enterprise Data Model
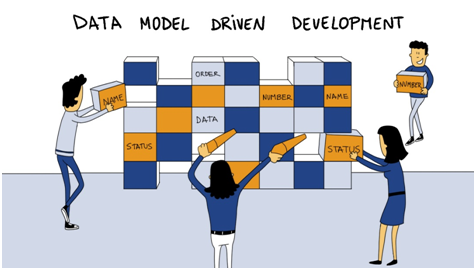
The enterprise data model should be mapped in a separate layer. In our reference architecture, this is the third layer: Single Source of Truth. This can be implemented in various technologies. We recommend the data model-driven approach for this. The requirements for enterprise data are modelled first.
We speak of the conceptual data model or the logical data model. This is used to derive the physical data model for the respective database system, which is created at least partially automatically. This approach has the advantage that changes can be easily tracked in the data model. This allows for an interactive procedure.
On top of the layer with the enterprise data model, a separate layer is built for private purposes. This can be sandboxed data or data models that are in local response. We call this layer: Multiple Versions of Truth.
Based on the data, various central services are offered. Typical examples are planning services, annotation services, data mining, or methods of advanced analytics. All these services are located in the service layers.
Data and services are combined in applications. These are located in the process layer.
The last two layers: Interaction Layer (the user or processes access the platform) and Multi-Channel Delivery (the results are distributed via different channels).
When selecting technologies, the different requirements and costs of implementation are taken into account. In addition to the data warehouse, we often see a data lake. Therefore, it does not make sense to consolidate the data in one place; different technologies bring different benefits. Furthermore, we want to avoid a technological and organizational bottleneck in our architecture.
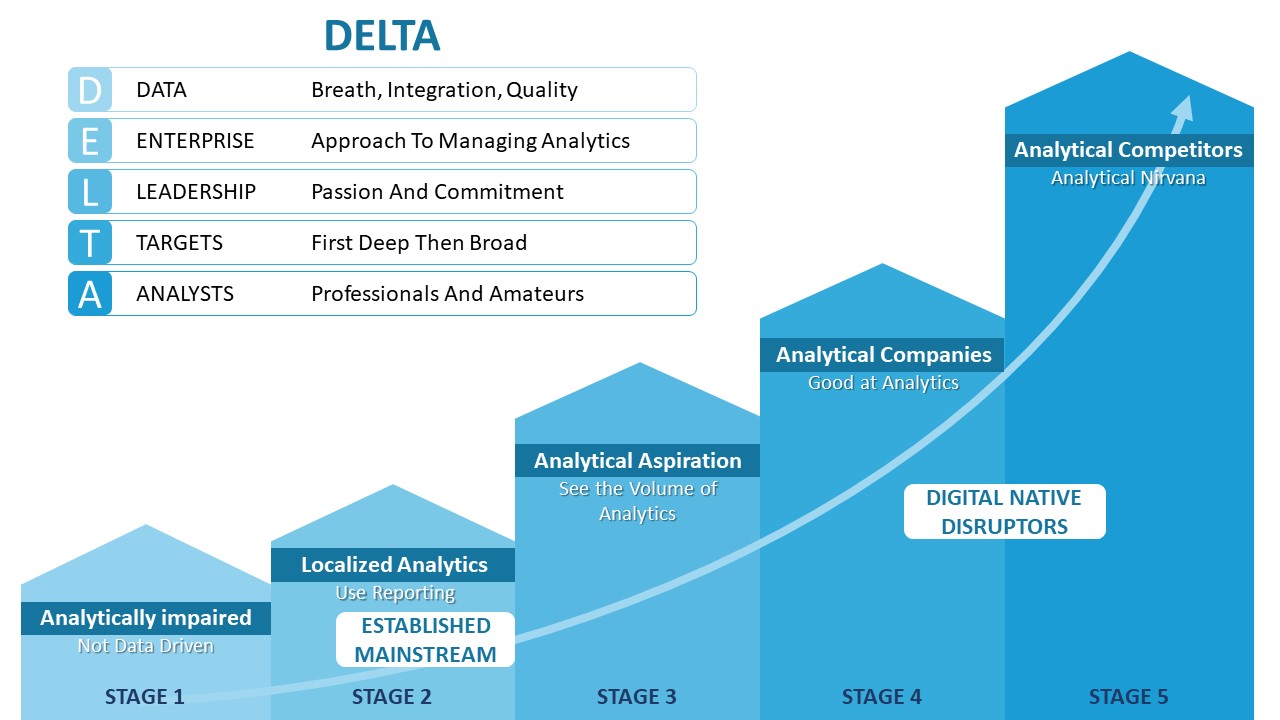
The Delta-Model: Competing with Analytics
What does it take to deploy ANALYTICS in your organization? What skills and resources do you need to be successful with analytics initiatives?
Tom Davenport has developed the Delta model for this and presented this in the book Analytics at Work. Delta is an acronym meaning Data Enterprise Leadership Targets and Analysts. The Greek letter delta is popularly used to symbolize “change.” It is a telling image of this model’s goal.
Together, we can change your business equation:
D ata: accessible, high-quality data
E nterprise: corporate orientation
L eadership: analytical leadership
T arget: strategic goals
A nalysts
Why are these elements so important? Good data is the prerequisite for everything analytic.
Some of the challenges of data management are much easier to overcome when the company as a whole “owns” relevant data, analytics software, and analytics talent. Besides, leadership across the enterprise should be motivated to collaborate on analytic initiatives.
You may ask, “But we’re starting small, with a specific problem in a single business function—why would we need an enterprise perspective?” The short answer is that you won’t get far without such a perspective for the following three reasons:
1. Large analytics applications always affect multiple areas of the business; they effectively improve performance and competitiveness.
2. If your applications are cross-functional, it doesn’t make sense to manage your key resources (data, analysts, and technology) locally.
3. Without an enterprise perspective, you will likely have many small analytic initiatives, but they will be insignificant.
Visionary managers view the development of analytic thinking patterns throughout the organization as a key success factor. Analytically minded executives will not write blank checks to fund analytics in general.
What really grabs their attention is the potential return on investment of using analytics there; where it makes a significant difference. It’s about sustainable success with business analytics and data governance.
An analytics goal can be strong customer retention, highly efficient supply chain performance, more accurate asset and risk management, or hiring, motivating, and managing a highly skilled workforce. Companies need goals because they cannot address all aspects of their business equally analytically.There is not enough analytic talent to cover all areas. Analytics need reasonable goals. Good goals are a separate topic, the detailed explanation of which is beyond the scope here.
Analysts have two main functions:
• Create and maintain models that help the business achieve its analytics objectives
• Bring analytics to the business by empowering management to value and apply it.
To make real progress, you need to put the five DELTA elements in the right relationship with each other. Organizations differ in starting points, capabilities, and rates of progress in analytics.
Data Governance as an essential success factor
Data form the best basis for new insights when viewed from different angles. Our current circumstances also require decisions to be made under uncertain conditions. Such situations are complex. Many different influencing factors must be taken into account.
A decision does not only have to meet today’s standards. Since many decisions have a long-term impact, they must also prove themselves in later contexts. Let’s just think of the attitude towards pollutant levels in the combustion engine, nuclear energy, etc. standards. Since many decisions have a long-term impact, they must also prove themselves in later contexts. Let’s just think of the attitude towards pollutant levels in the combustion engine, nuclear energy, etc.
It has proven beneficial to incorporate different perspectives and requirements into the way decisions are handled.
Additional requirements also need another fixed framework. Here at CubeServ, we like to talk about the difference between the factory, the manufactory, and the laboratory. What happens in a factory is characterized by efficiency and repeatable results.
We think of it as the monthly or year-end closing. In a manufactory, it’s much more about a successful one-off result. A good marketing campaign tailored to an appropriate target group is valid at a certain point in time. The next campaign needs a different segmentation. And last but not least, the laboratory: ideas need to be validated quickly here.
The goal is to pursue promising ideas and discard less promising ones.
We see that successful business analytics and data governance are closely related.
The governance concept sets the following technical and functional guidelines and is decisive for a successful implementation:
- Establish BI organization
- KPI definitions: Develop a catalog of responsibilities and acceptances
- Modeling guidelines: Specifications and regulations in the context of data modeling
- Requirements elicitation: template with must-have content
- Development standards: Definition of guidelines for development/programming, including transport system
- Naming conventions: Establish specifications when naming objects. Goal is to build a framework for defining questions and solutions.
- Test concept with definition of quality checkpoints
- Authorization concept: Establish a concept that is compatible with the surrounding systems.
Today, we can know as much about our customers as we did in the days of the corner store.
We incorporate this knowledge into our offerings in a targeted manner.
We want to meet customers where they are and offer them what they need. This is worthwhile for the customers and we benefit from a valuable relationship.

Added Value:
Thanks to pattern recognition, customer-specific value propositions are created. This is how we strengthen customer loyalty and set ourselves apart from the competition. Potential & Benefit: Fast and well-founded identification of promising customers through access to valid and up-to-date data. We have better control of the results of the individual customer segments.
Published so far:
- Part 1: How to make business analytics successful?
- Part 2: Business Analytics vs. Business Intelligence
- Part 3: What is SAP Analytics? The SAP Data Warehouse Portfolio
- Part 4: SAP Analytics – The Front End Products
- Part 5: Data Platform – An Important Pillar of Digital Transformation
- Part 6: On the Way to AWS
- Part 7: Cloud – Curse of Blessing?
- Part 8: Leading wit Data – Why Power BI is Often a Choice